
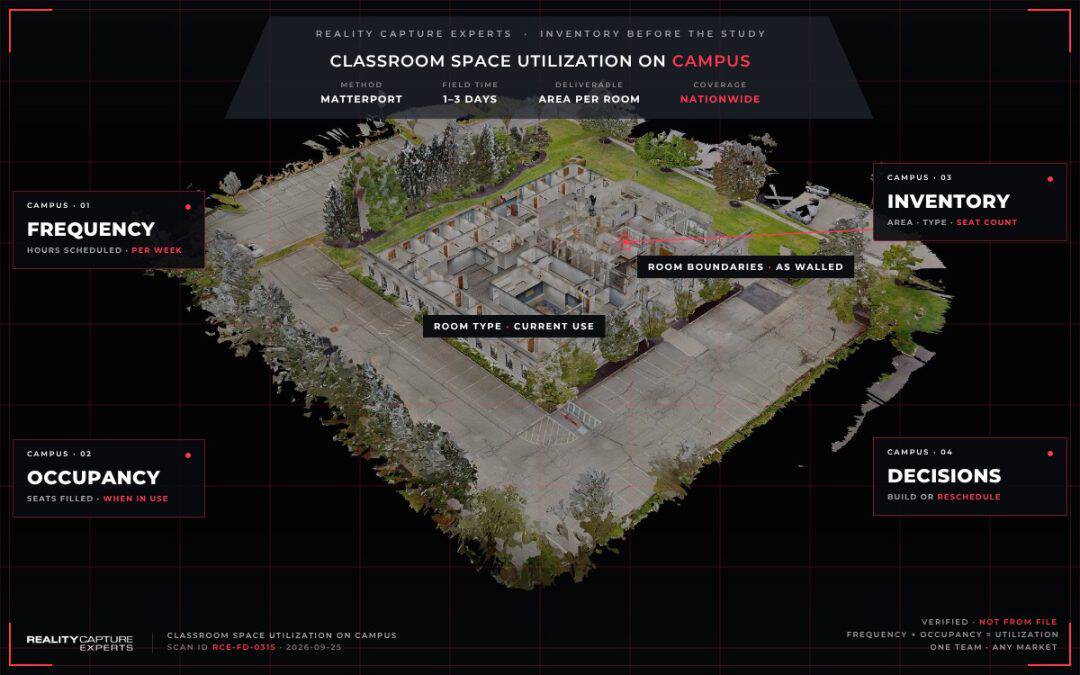
Classroom space utilization is measured from two numbers: how many of the available hours a room is scheduled, and how many of its seats are filled when it is. Both depend on a room inventory that is accurate on area, seat count, and room type, which is where most campuses run into trouble.
The calculation is not the hard part. The inventory is. A utilization study built on a stale room list produces a number that nobody will act on and everybody will dispute.
Key Takeaways
- Utilization is frequency of use multiplied by occupancy, and both depend on an accurate room inventory.
- Inventories break because the scheduling list, the drawings, and the building itself disagree with one another.
- A measured capture rebuilds the inventory from the building, with current room area, room boundaries, and room use.
- Results often point to a scheduling change rather than new construction, and that conclusion is only defensible with a solid inventory.
What are the standard utilization benchmarks?
Two figures do most of the work. Frequency of use is the share of available hours a room is scheduled, and occupancy is the share of seats filled during those hours. Multiplying them gives a utilization rate that accounts for both an empty room and a half empty one. In higher education, roughly 40 hours per week is a common benchmark for classrooms, with teaching laboratories set lower at around 26. Cornell’s room utilization rate divides scheduled class time by available minutes per semester week and targets an adjusted ratio of 0.8 to 1.0.
K-12 districts rarely use those figures directly, but the logic carries over. A district deciding whether it needs a new elementary building is asking the same question a provost asks about a lecture hall.
Why does the room inventory break the calculation?
The inventory is usually assembled from three sources that disagree. The registrar or scheduling system has a room list with capacities, the facilities office has drawings with areas, and the building itself has walls that were moved in 2011 without either record being updated.
The failure modes repeat across campuses. Rooms that were subdivided still appear as one large room, and rooms converted to storage or offices still appear as classrooms. Seat counts reflect the furniture that was ordered rather than the furniture that is in there now, and square footage comes off a drawing that predates the last renovation. Each of those errors pushes the utilization rate in a different direction, which is why a study built on a bad inventory produces results that feel wrong to the people who use the buildings. Once the room list is questioned, the study stops being useful.
How does a measured capture fix the inventory?
A capture with measurable floor plans rebuilds the inventory from the building rather than from the file. It gives an area figure for each room as it exists today, room boundaries as they are walled today, and a visual record of what is in each space. That produces an area figure that can be trusted as a denominator, a room type that reflects current use so a converted classroom stops being counted as instructional space, and a seat count that can be verified visually rather than taken from a purchase order.
It also means the next study does not start over. When the inventory is tied to a captured record, the following year’s work is a comparison rather than a rebuild. Getting that consistent across a whole campus or district is the coordination problem covered in how to document facility conditions across an entire school district: one written capture scope, one standard, every building.
What do you do with the result?
Utilization data answers three decisions. The first is whether to build, because a campus running well under benchmark has capacity it is not scheduling. The second is whether to convert, because rooms that sit empty are often the wrong size rather than unwanted. The third is whether to change scheduling policy, because utilization is frequently a timetable problem rather than a space problem.
That third decision matters most. Districts and campuses often find the shortage is concentrated in a handful of hours, and the answer is a scheduling change rather than construction. That conclusion is only defensible if the room inventory behind it is solid.
What Happens Next
If a utilization study is planned, the capture should run before it, not after, so the study starts from a verified inventory. RCE sets one capture scope across the campus, deploys technicians building by building, applies specialist quality control to every scan, and delivers measurable floor plans and area figures in one consistent format. One point of contact handles scheduling, coordination, and delivery. Reach the team at 833-723-8326 or info@realitycaptureexperts.com.
Related reading: how to document facility conditions across an entire school district and what goes into a facility condition assessment for schools.
External references: ACUA, Auditing Campus Space Utilization and SCUP space assessment resources.
Frequently Asked Questions
What is a good classroom utilization rate?
In higher education, around 40 scheduled hours per week for classrooms and around 26 for teaching laboratories are common benchmarks. Compare against your own institution’s target rather than a national figure, because term structure changes the math.
Do we need occupancy sensors?
Sensors measure whether people showed up, which scheduling data cannot tell you. They do not fix a wrong room list. Most campuses get more value from correcting the inventory first, then adding sensing where the numbers still look implausible.
How long does a campus capture take?
One to three days per building for typical academic buildings, with access windows setting the calendar more than scan hours do. A mid sized campus is measured in weeks of field time.
Can the floor plans feed our space management system?
Yes. Deliverables are produced in standard formats so area and room data can be loaded into a space management or facilities system. Confirm the target format before capture so it is set once.